How to Analyze App Download Data in Google Play Console
Whether developing a mobile app or handling its marketing, the Google Play Console is an indispensable tool for monitoring user activity on its Android version. It equips app developers and marketers with comprehensive insights into app performance, covering growth metrics, technical issues like crashes, and financial information. The Console provides in-depth download (acquisition) reports, leveraging authentic data from Google’s own app store, Google Play. This ensures a precise representation of your app’s performance. Its key functionalities include tracking conversion rates and pinpointing the specific sources of user traffic.
Analysis of Installations, Users, and Traffic Sources:
Over the past year, Google has refined its approach to attributing downloads to specific traffic sources. This advancement notably enhances the ability to evaluate the success of both paid campaigns and, crucially, organic growth originating directly from the store. The improved depth of analysis now available in Google Play significantly bolsters the ASO (App Store Optimization) process. This involves analyzing the app’s organic traffic, assessing its effectiveness, and honing in on strategic keyword targeting.
Main Changes:
- Differentiation between Paid and Organic Traffic Sources: Google now enables splitting up traffic stemming from paid campaigns, which encompasses users arriving via Google Ads campaigns (previously known as UAC).
- Distinction between Branded and Generic Searches: This involves categorizing downloads resulting from branded searches (searches including the brand or app name) and differentiating them from store browsing and generic searches (queries related to app utility, features, specific categories, and competitor names).
To accurately determine the number of downloads your Android app has garnered from various channels, such as paid traffic sources, brand searches, generic searches, and browsing, it’s essential to comprehend Google’s official classifications of traffic sources. Admittedly, this can be somewhat perplexing as there are two distinct tiers of traffic source analysis within Google Play. Each traffic source is assigned a value based on one of these analytical levels, referred to as ‘Traffic Source Value.’ These levels are:
- Overall Store Analysis:
This is a broader, less detailed analysis, offering a general overview of traffic sources. - Store Listing Analysis:
This level provides a more granular, detailed analysis, offering deeper insights into traffic sources.
Beginning with the first tier of analysis,
The Overall Store Analysis, let’s explore the different values assigned to traffic sources:
- All Traffic Sources:
This category encompasses every user who has installed an app from any section of Google Play, provided the app was not previously installed on any of their other devices. It accounts for all methods of discovery and installation. - Google Play Explore:
This traffic source includes users who discovered and installed an app simply by navigating through Google Play, without performing a specific search for the app’s name. It covers activities like browsing the Google Play homepage, exploring app recommendation sections, checking out category leaders, or conducting general utility searches (for example, looking up ‘PDF scanners’ or ‘games for children’). - Paid and Direct:
This represents the segment of users who installed an app following a direct search for the app’s name or its associated brand on Google Play, or via paid advertising campaigns (such as those on Google, Facebook, etc.).
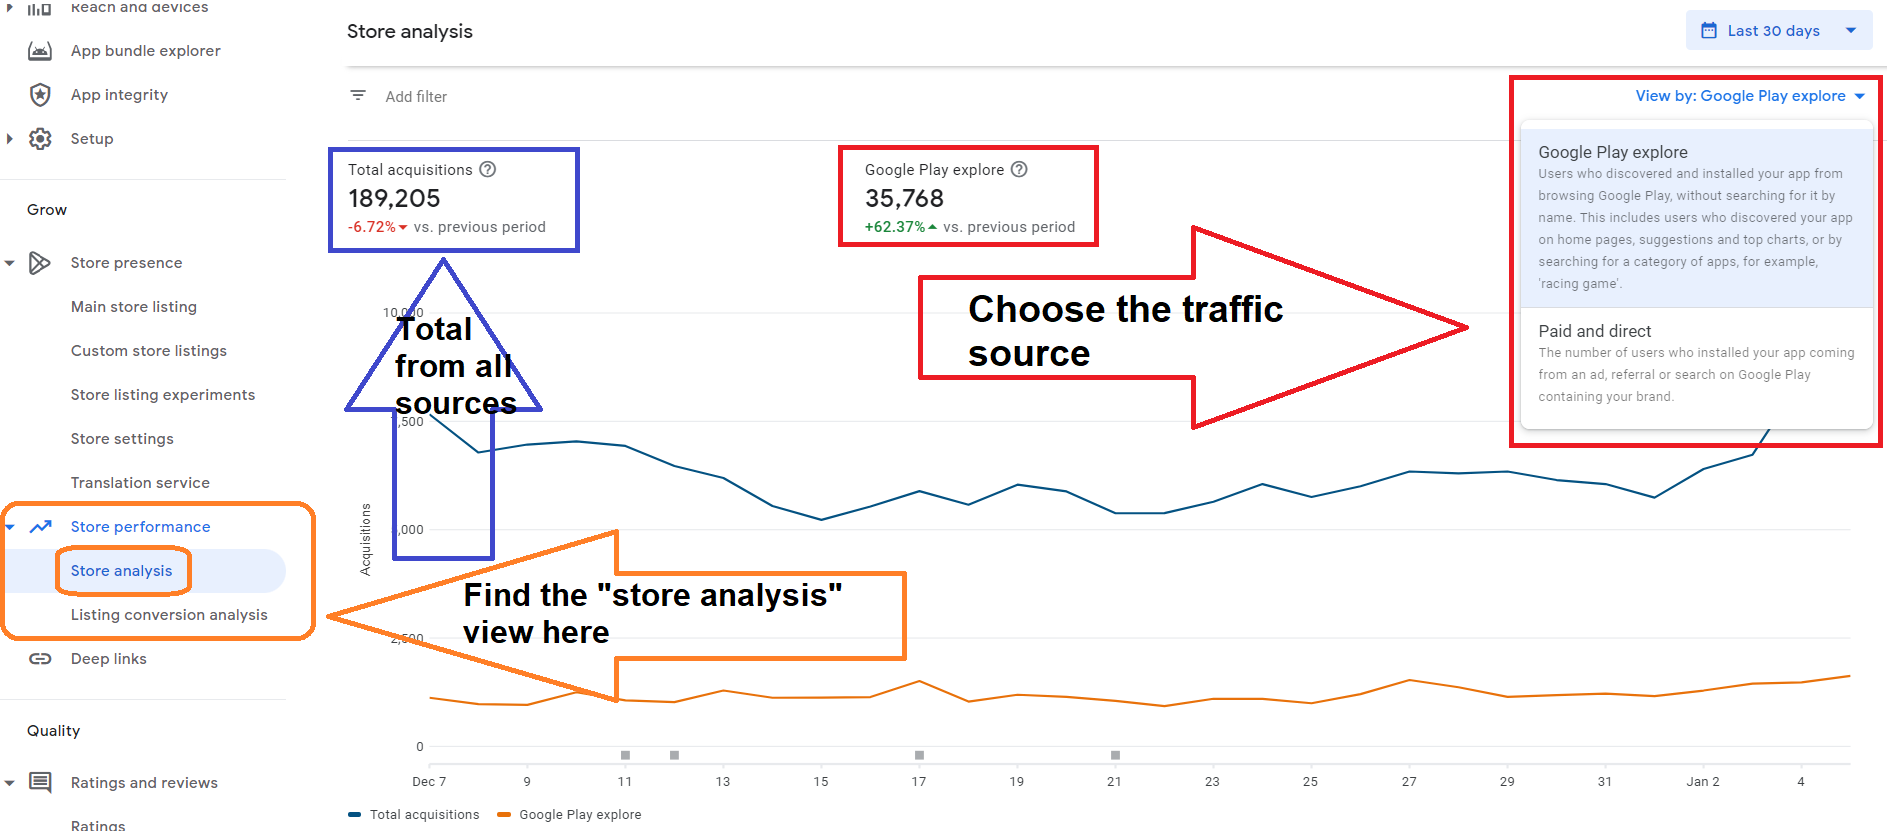
This is the appearance within the Google Play Console itself:
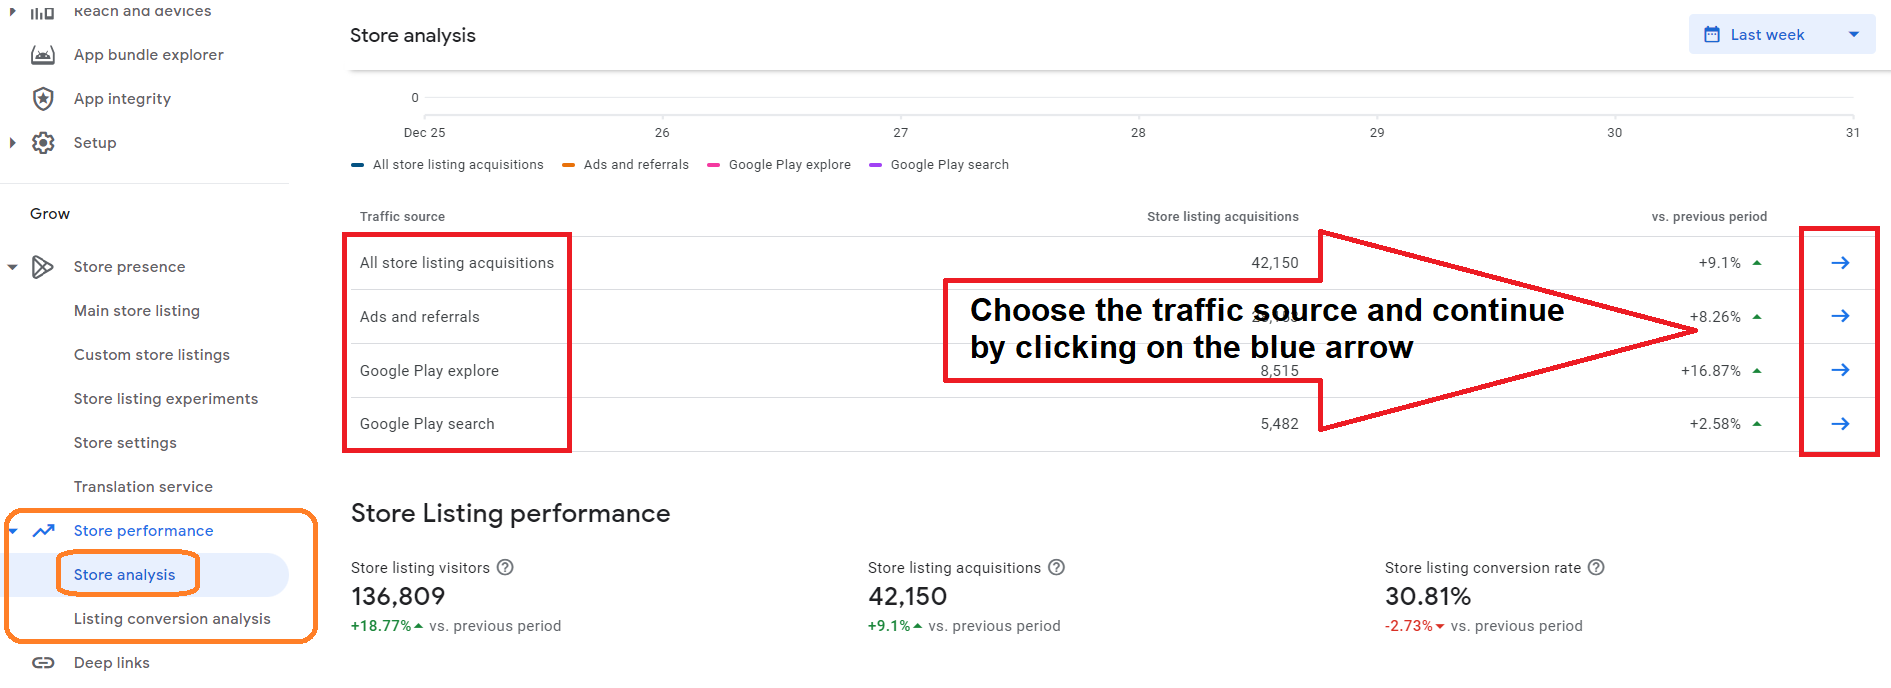
Store Listing Analysis in Google Play: A Closer Look at Detailed Traffic Source Evaluation
- All Traffic Sources:
This metric captures all users who visited the app’s store page or a minimal detail page and subsequently installed the app, assuming it wasn’t already installed on any of their other devices. It’s important to note that this figure excludes any installations originating from ads in specific locations, such as banners on category pages. - Google Play Search:
This source accounts for users who located the app page by searching within Google Play, either by the app’s name or its associated brand. It encompasses those who visited the store page or a brief display page prior to installation and who didn’t previously own the app on other devices. This metric specifically omits visits resulting from ads shown in the Google Play search results. - Google Play Explore:
This category represents users who navigated through Google Play, visited the app’s page, and then installed the app, again, provided it wasn’t installed on their other devices. This group includes users who utilized the Auto suggest feature during searches and those searching for an app by category, such as ‘PDF scanner.’ Visits from ads within Google Play are not included in this metric. - Ads and Referrals:
This traffic source covers users who arrived at your app’s page via an advertisement or referral and then proceeded to install the app, given that it wasn’t previously installed on their devices. This includes installations via ads that feature an embedded installation layer (inline), which may sometimes be displayed outside the Play Store.
Below is a depiction of how these analytics are presented in the Google Play Console itself (you may need to scroll down on the Store Analysis page):
Understanding the Key Differences in Traffic Source Values:
Navigating the intricacies of traffic source values in Google Play can be challenging. To aid in this understanding, the following summary table delineates the primary differences between the two levels of analysis: Overall Store Analysis and Store Listing Analysis.
| Traffic Source / Level of Analysis | Overall Store Analysis | Store Listing Analysis |
| All Sources: | All users who installed your app with or without visiting store listing. | All users who installed your app after visiting your store listing. |
| Google Play Search: | Not applicable, as it’s included under the Explore category. | Users who installed your app following a search for the app’s name or related brand, typically indicating branded searches. |
| Google Play Explore: | Users who installed your app after either browsing in Google Play or conducting a search that does not specifically mention your app’s name or associated brand. | Users who installed your app after browsing in Google Play or conducting a non-branded search that doesn’t include your app’s name or brand. |
| Paid & Direct: | Users who installed your app due to an ad referral or direct search of the app’s name or associated brand. | Not applicable, represented in Search and Ads & referrals |
| Ads & Referrals: | Not applicable, represented in “Paid & Direct” | Users who accessed your store listing through an ad or referral. This encompasses installations via the inline install overlay sometimes used outside the Play Store. |
In summary, the Overall Store Analysis encompasses all user installations regardless of store listing visits. Also, this level doesn’t distinguish between branded searches and installations from paid campaigns. On the other hand, the Store Listing Analysis is focused solely on users who have installed the app after visiting your store listing. It also distinguishes between branded and non-brand searches that drove an install.
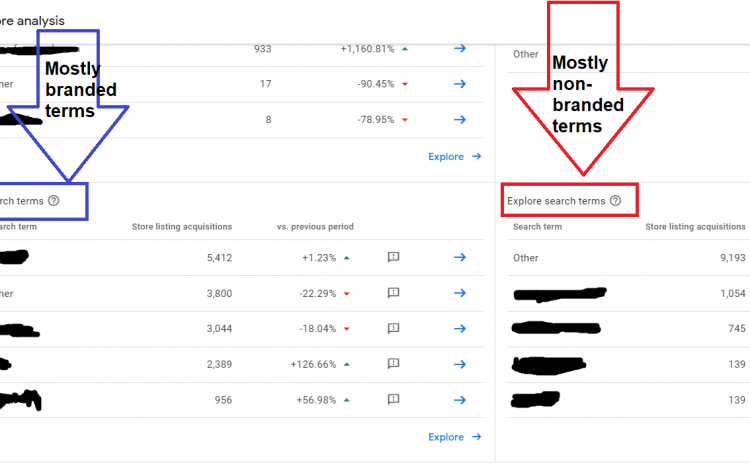
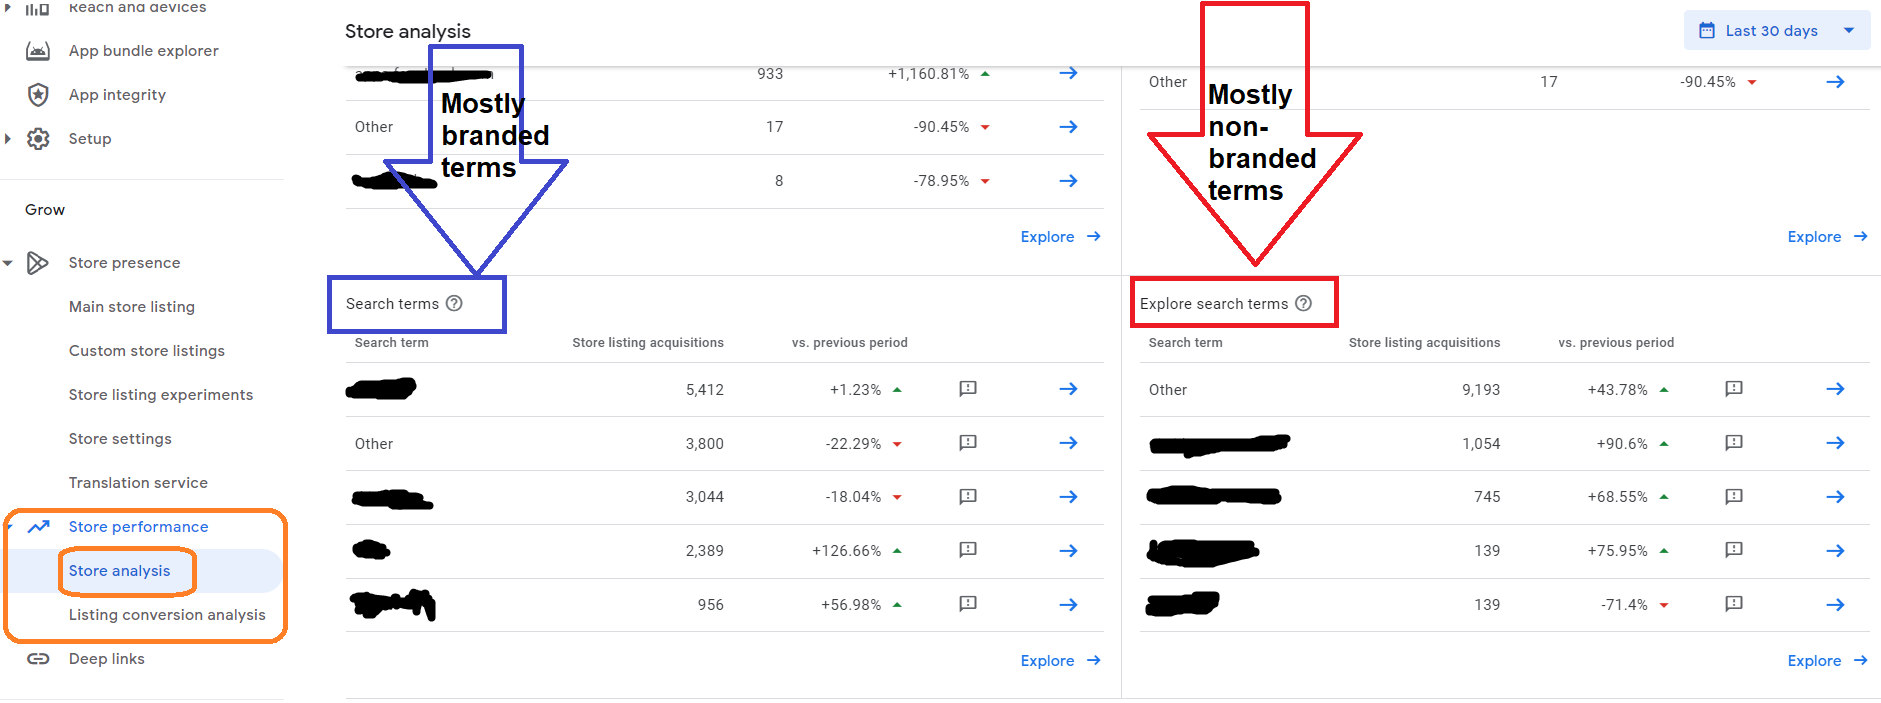
Practical Example:
To identify generic search terms leading to high rankings and increased installations for your app, you should utilize the Store Listing Analysis. Select Google Play Explore as your traffic source, assuming there’s substantial installation volume from popular search terms you should see a breakdown of these terms as follows:
You can view this analysis in the Google Play Console report by scrolling to the end of the Store Analysis page:
Conversion Rate Analysis:
Google Play Console not only facilitates traffic source analysis but also provides insights into user conversion rates. This analysis can be segmented in various ways, including but not limited to the traffic sources as previously mentioned and by country, language of the app version, search terms, and more.
The conversion rate within Google Play is determined by the ratio of the app’s installations to the total number of visits to the app’s page. Notably, this calculation excludes visits from users who already have the app installed on any of their devices and does not consider re-installations by these users.
A notable advantage of Google Play’s conversion rate analysis, in contrast to platforms like Apple App Store Connect, is the capability to benchmark these rates against standard industry metrics (Although App Store Connect also offers some benchmarking, it is far less flexible for analysis compared to Google Play’s benchmarks).
Utilizing Benchmark Metrics for Conversion Performance:
Benchmark metrics are invaluable for app developers and marketers, as they enable a comparison of their app’s conversion performance with that of peers in the industry. By scrutinizing these metrics, areas needing improvement become evident. For instance, if an app’s conversion rate in a specific language is noticeably lower than its competitors in the same category, it might suggest the need to re-evaluate the app listing’s translation accuracy in that language.
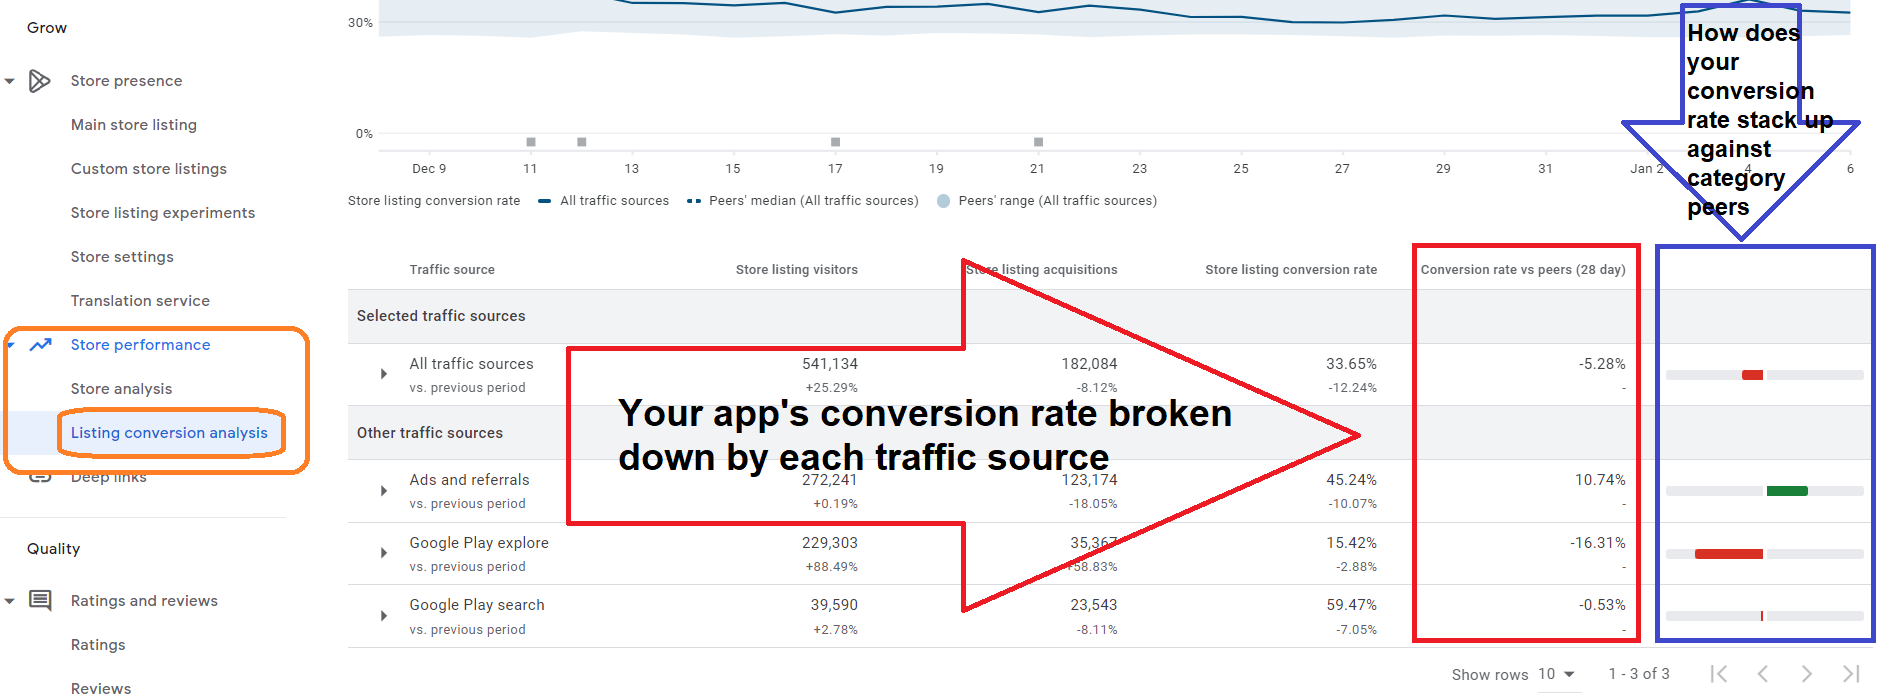
The store listing conversion chart in Google Play Console facilitates a daily assessment of an app’s conversion performance. It compares this performance against the median and the 25th and 75th quartiles of peer apps. Moreover, a detailed data table provides insight into how the app’s overall conversion rate for a chosen period stacks up against the median of peers in the preceding 28 days. This comparative analysis is crucial for marketers and developers to gauge their app’s effectiveness and implement necessary enhancements.
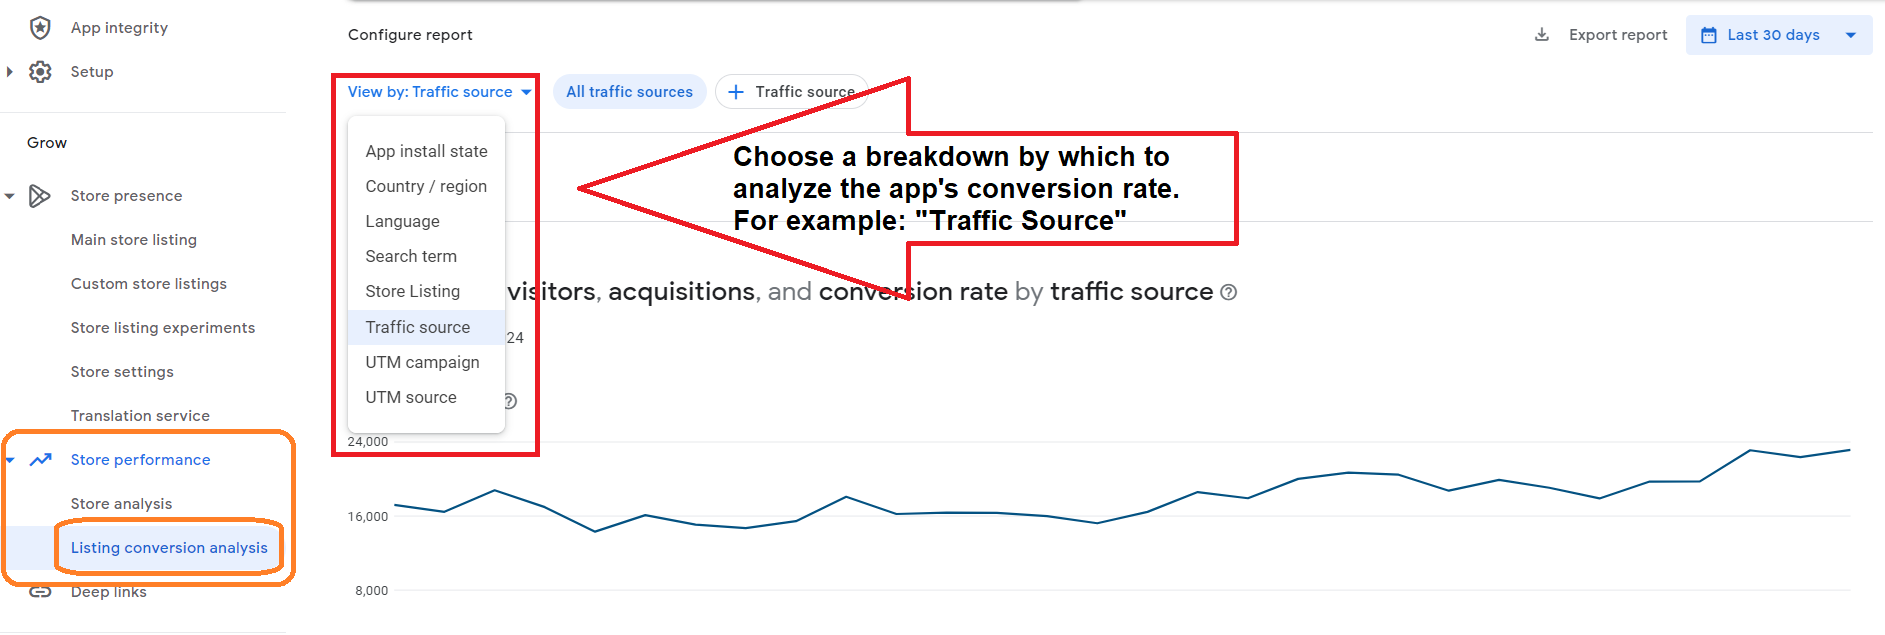
To access this conversion rate analysis, navigate to the ‘Listing conversion analysis’ option in the left menu of the Google Play Console. Here, you can select the specific aspect you wish to analyze, such as country or traffic source.
The interface will display the analysis as follows:
Now, by scrolling down the page in the Google Play Console, you have the ability to analyze your app’s conversion rates across various channels. This enables you to directly compare how your app’s performance stacks up against competitors within the same category:
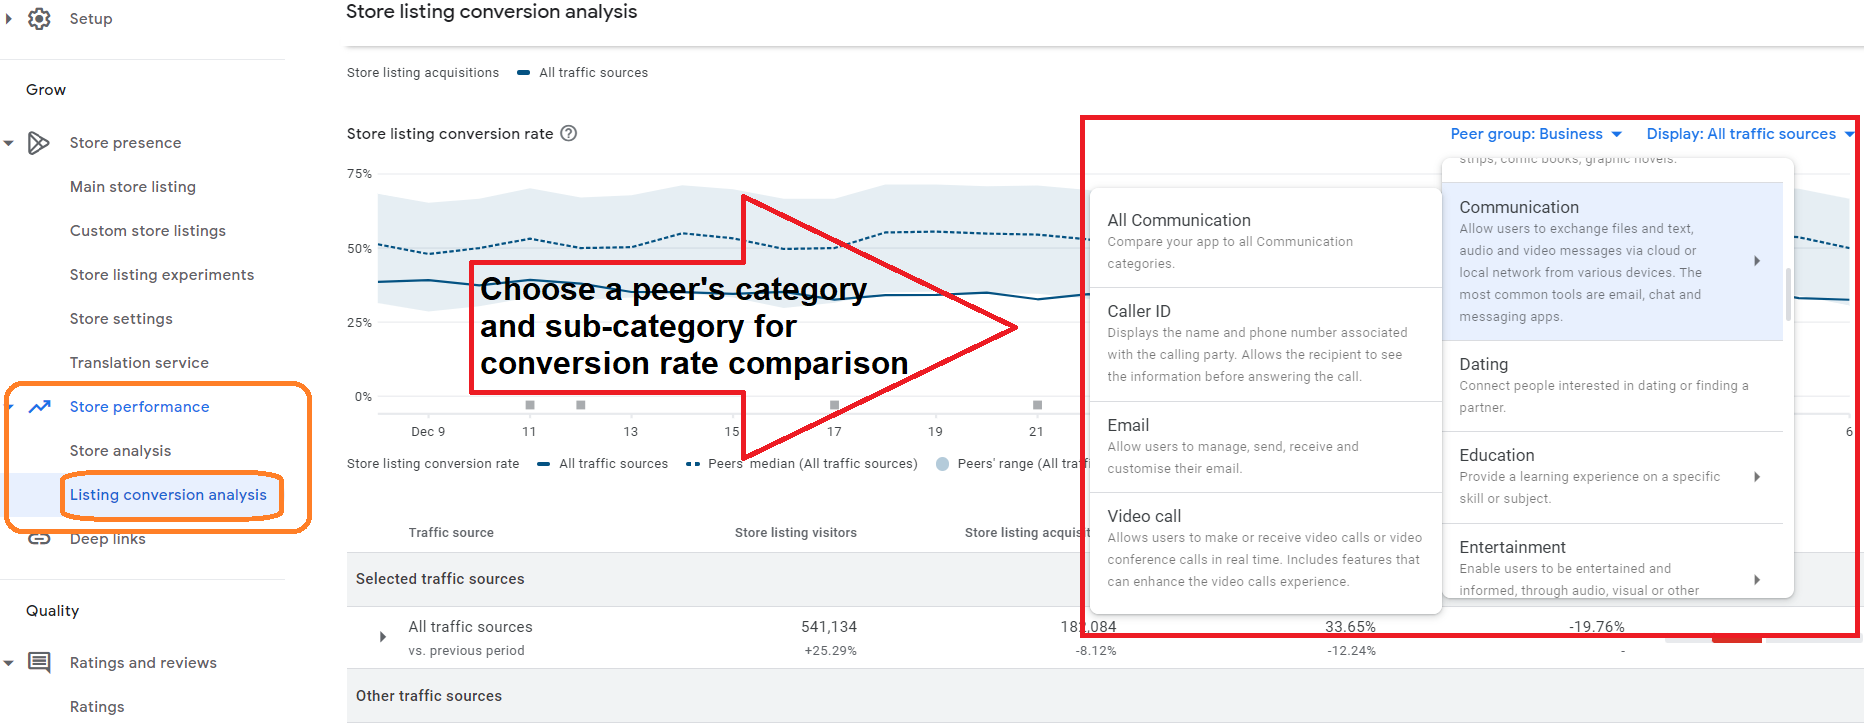
Additionally, the Google Play Console provides the flexibility to shift the reference point of your analysis from your app’s current category to other categories. To do this, simply scroll up a bit on the screen and select the designated area for category adjustment:
Now, with the tools and knowledge provided by the Google Play Console, you can thoroughly analyze your Android app’s installation data and conversion rates. This comprehensive approach will yield valuable marketing insights, crucial for effectively marketing and promoting your app.
Written in partnership with:
Yuri Shub is a mobile app growth consultant specializing in mobile app growth strategy, ASO, and User Acquisition. He founded Topanda, a marketing agency focused on these areas.